InAnalytics VidhyabyRoberto SalazarOperations Research with R — Diet ProblemExploring the “lpSolve” R packageNov 28, 20201Nov 28, 20201
Joanna16 Most Useful RStudio Add-insAdd-ins are plugins that extend RStudio’s functionality, allowing you to perform tasks more efficiently. In this article, I’ll share some…Feb 181Feb 181
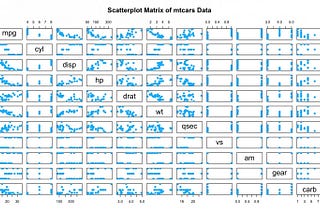
Marc LambertsP-values in football: assessing thee validity of correlation in scatterplotsScatterplots. Football analysts in the public space absolutely love them and I’m one of them. I have been using them for years to show two…Jan 275Jan 275
AdamDeep Q-Learning Applied to Algorithmic TradingIn the book “A Random Walk Down Wall Street”, the author Burton G. Malkiel claimed that: “a blindfolded monkey throwing darts at a…Oct 12, 20244Oct 12, 20244
Tolmachev Mikhail“Not Just ggplot2: Visualization in R”If, after reading this article, you decide to incorporate R into your work, be prepared for a real adventure. R is a fully-fledged…Jul 7, 20241Jul 7, 20241
InTowards DevbySarah HoubenR: Quarto CV creation (HTML output)Did I already tell you that I really love Quarto? Probably! Here I come again with my love for this wonderfull framework!Jul 22, 2024Jul 22, 2024
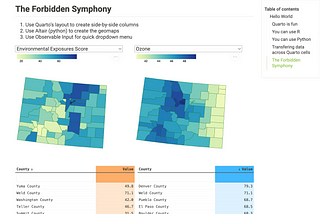
Jung Hoon Son, M.D.Using Quarto to Create Interactive Data Visualizations using Python, R, and ObservableQuarto’s Markdown-based system. Python’s data processing prowess. R’s data presentation libraries. Observable’s dynamic widgets. The…Feb 24, 20242Feb 24, 20242
InTDS ArchivebyJonte DanckerConfidence Interval vs. Prediction IntervalA small but important difference that you should knowNov 24, 202410Nov 24, 202410
InTDS ArchivebyAyman BariHow to model a social network with RA practical introduction to network theoryJun 24, 20202Jun 24, 20202
HamardikanMengapa Background Pendidikan STEM Cenderung Lebih Konservatif di Indonesia?Sebuah analisis tentang kecenderungan konservatif di kalangan mahasiswa STEM dengan studi kasus Universitas Indonesia.Nov 20, 2024Nov 20, 2024
InTDS ArchivebyMatthew TurkHow to Forecast Time Series Data using any Supervised Learning ModelFeaturizing time series data into a standard tabular format for classical ML models and improving accuracy using AutoMLFeb 22, 202414Feb 22, 202414
Stephen Chege6 Ways to Get Started With R for Spatial Machine Learning AnalysisR is a potent machine learning program whose features flow naturally into the study of geographical data, opening up new avenues for…Nov 12, 2024Nov 12, 2024
Robson TigreWhen and how to apply causal inference in time seriesIntuition, step-by-step script, and limitations of the CausalImpact and CausalArima methodsSep 17, 20242Sep 17, 20242
Darshan KhandelwalScraping Google Search Results Using RR, a programming language for statistical computing, was developed by two professors from the University of Auckland, Ross Ihaka and Robert…Jun 27, 2023Jun 27, 2023
InTDS ArchivebyAmanda Iglesias MorenoTop 5 Geospatial Data APIs for Advanced AnalysisExplore Overpass, Geoapify, Distancematrix.ai, Amadeus, and Mapillary for Advanced Mapping and Location DataOct 6, 20244Oct 6, 20244
Alessio GasperiPredicting Income Levels: A Logistic Regression Analysis in RAs many of you might know, Logistic Regression is a statistical method used to model the probability of a binary outcome. In this project…Apr 28, 2024Apr 28, 2024
InAppsilonbyDario RadečićIntroducing Shiny Assistant — You Can Now Build Shiny Applications with GPT and GenerativeAIWe built an entire R Shiny application with Shiny Assistant — A GPT model specialized in Shiny (R and Python). Is it any good?Sep 16, 20242Sep 16, 20242
InAppsilonbyDario RadečićR tidymodels: A tidyverse Like Ecosystem for Efficient Machine Learning in RDo you feel machine learning in R leaves a lot to be desired? You’re not alone. Try R tidymodels — it’ll feel right at home if you’ve used…Aug 15, 2024Aug 15, 2024
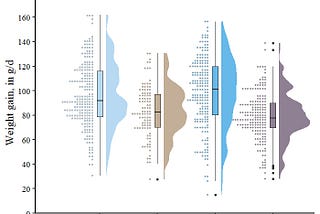
Guilherme A. Franchi, PhDRaincloud plots for clear, precise and efficient data communicationLearn the steps to plot a raincloud plot in R and improve your data communicationNov 16, 20232Nov 16, 20232
btdsurvival: Step-by-Step of Guide to Perform Survival Analysis in RSurvival analysis is a statistical approach used to analyze the time until an event of interest occurs. The event could be anything that…Nov 24, 2023Nov 24, 2023